Project Background
Shahriari Farnaz, Torrone Andrea, Zhu Tao
Client
IGPDecaux is an Italian out of home market leader. They are providing city assets like billboard, street furniture, bus shelter, subway ads and airport ads. Their mission is to make cities more welcoming, enjoyable, comfortable and for everyone to benefit from a better quality of life.
My Contribution
I have guided the process from preliminary research, synthesis, design decisions, then prototype development and testing. My notable contributions were in designing the wireframe and UI with Sketch App, prototyping in Unity with Kinect SDK, and Writing the usability plan.

Brief
Waiting for the bus is always boring and the billboard format is always the same. People felt that they waited too long at bus stops, sought entertainment measures while waiting, found advertising content irrelevant, habitually ignored, overloaded with advertising messages, and were in noisy and crowded environments.

Design Challenge
How might we create a way to reduce the boredom during the waiting time?
Solution
Create an innovative digital billboard, connects people with gesture-controlled virtual paper planes that deliver brand messages. Make the waiting time not boring. In the meantime, the billboard collects interaction data from users and help IGPDecaux to achieve a new profit model and help advertisers to understand more about their customers.
Discovery
From assumptions to a research plan
After getting a brief introduction from the company, we came up with some assumptions and questions. These questions included who the users were, the scenarios, and the business goals IGPDecaux wanted to achieve. Then we prioritized these hypotheses and questions and developed a detailed research plan.


Demographic Study of Milan
According to demographics data in 2018, there are 3.2 million residents in Milan. The residents divided by 48.5% Male and 51.5% Female. Only 14.5% of residents are foreigners, and the average age is 44.8 years old. About public transportation, the average amount of time people wait at a stop or station in Milan is 11 min, while 12% of riders wait for over 20 minutes on average every day.

Insights from Contextual Inquiries.
I did some observations and interviews in some bus stops and metro stations, . In order to build team alignment, I used the empathy map to synthesis and shared the collected Insights. Here are some behaviours I noticed from observations: People always looking at the phone (WhatsApp/Instagram), looking around, staring and thinking, listening to music, chatting with friends. Also I got public’s opinions from interviews: They disinterest in billboard content, information overload, repetitive advertising, damaged billboards, noisy environment… With these insights, me and other teammates are more confident to move to the DEFINE part.


Define
Persona
The chosen persona is Francesco, a 25 years old italian new graduates. He is a introvert person and very proactive in everything. As a fresh graduated computer engineer, Francesco works in a software company and at the same time, he still has some collaboration with his university professors on a research project. So these days he spend most of his day time at work and university, and of course he have a regular commuting schedule.
Journey Map and Experience Map
We also made a customer journey to illustrate Francesco’s commuting experience. The customer journey map was more focused on his activities’ pain point and highlight. With this map, we discussed and analyzed his action during each step, extended more elements like think, feel, wish to detailed the inner thought of Francesco. From these maps and also the raw data from research part, we come up with some key insights.
Key insights to “HMW” question.
The general process in this part is to summarise and cluster the key insights, and then according to these insights, we need to think about the meaningful design points and express it in an HMW format. To filter the most important HMW question, we prioritized these questions by using impact as a standard.

In the picture, you can see the six key insights we summarised. Key insights help us generate HMW questions, and we had many questions worth to develop. After a vote session, we finally decide the most critical HMW question we are going to develop.
"How might we create a way to
"
Develop
Understand the trends and profit model
At the beginning of the ideate session, we conducted desktop research in three directions to deepen our understanding of the outdoor advertising industry. These included smart city trends, digital advertising trends, and trends brought by new technologies.
In the meantime, the team investigated what the types of internet advertising are: for example. There are banner ads, in-feeds ads, open screen ads, Interstitial ads, hover ads, Pre-Roll Ads, etc.
Also studied the way it is priced: per click, per action, per impressions, per time, per conversion, number of sales, etc. By comparison, the traditional outdoor advertising pricing model is very limited: E.g. format, circulation, impressions and sale.

Brainstorming
With a deep understanding of users, operational scenarios, business objectives, and the outdoor advertising industry, a quick brainstorming session was conducted. We categorized, named and discussed similar solutions. In this step, the connecting cities group is particularly prominent, which can solve the user’s pain points well, as well as bring a new pricing method to IGPDecaux through a digital solution, improving their profitability and create business value.

Idea Selection
In order to filter options efficiently, we use a priority grid to help us make decisions. This grid is made up of two quadrants: impact on the users and feasibility to the team. As you can see, we chose “connected billboard” as the final winner for further refinement.

Future Storyboard
In this future storyboard, users can send virtual paper planes to strangers in the city via smart billboards while waiting for the bus, and interact with ads in the meantime.
This novel concept makes people notice of the flying paper plane in the billboard first. Then after reading the prompts, the user stands at a designated location to grab and open the paper plane. The content inside is a GIF of an advertisers’ product. After selecting a product that they find interesting, the user can stamp in the paper plane, which refers to their personal footprint, also is visible to people who select the same product. Finally, the paper plane will be sent to another corner in the city. As you can see, this type of ad gives the user a more entertaining, game-like interaction.

Click to expand
Delivery
Wireframe and Test
From the storyboard, we came up with some basic user requirements, such as 1. brand information: to reinforce the brand connection during the interaction, 2. action reminder: a text description of an action the user should perform, and 3. gesture reminders: visual icons to educate the user of the gestures they should perform. With these three requirements in mind, I discovered a few possible layouts with had drawn and chosen one as the low-fidelity prototype (digitalized with Balsamiq).
A test plan followed after when the wireframe finished. We got a lot of feedback on this step. See the feedback form.


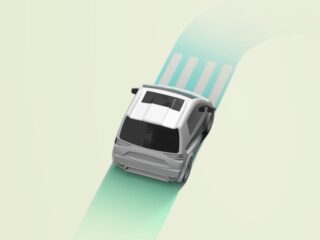
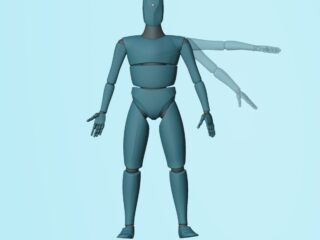
Kinect Study and Gesture Design
From the desk study, we chose the Kinect as the gesture sensor and calculated its best placement position and angle. From the previous feedback grid, it is clear that users want the gesture design to be easier to understand. We studied Kinect human interaction design guidelines, and defined five gestures: grab, open, swipe, press (select), throw and designed the corresponding virtual animated characters to make it easier for users to understand.


User Interface Design
Then, I made a new high fidelity design with Sketch. The new design optimized the interaction flow and reduced the interaction time, and it will displays user silhouettes on the screen as feedback to help users observe their own gestures. Click the picture to see more detail of improvements from the last wireframe.

Click to expand
User Interface Demo
When the user catches the paper plane, the instruction will encourage the user to unfold it and highlight where the paper plane comes from.
Then, a question and answers show up after user unfold the paper plane. The answers represent by gifs. When the user pushes and selects the answer, the rest gifs will fade out. (In this prototype it doesn’t, we have a bug here.)
After the user selects the answer, several location stamps will present to the user. The location stamps represent the other citizens who chose the same answer, and stamps are location-based, like footprints, to make the user feel belonging to a group.
Finally, the user needs to send the paper plane back to the city, and check where it goes.
Usability Test and results
When the final design finished, we need a usability test to validate our ideas. The final usability test aims to investigate the following point: the overall score of the system usability, the user’s understanding of the right standing position, the connection of brand, test user’s gesture execution, and the satisfaction of the overall process. Investigation method mainly includes questionnaires (system usability scale), observation and interview. After the test was completed, our team made feedback gird again for sharing the gained insights during the test.


Here is a video clip from the usability test. The interactive prototype was developed in unity. I imported design from sketch to Unity, set up the event listener to communicate with Kinect. In order to simulate the atmosphere, we made a small scene with some wood plank, and a projector was used to reproduce the screen of the smart billboard.
Final Iteration
Some improvements were made according to the feedback grid.
Many testers didn’t notice where were the gesture animations. So we changed the first animation in the position of the user’s line of sight and then made it move down. We also redesigned unfold gesture, we put two hands close to the paper plane. This way is more intuitive and noticeable than full body animations.
The instruction: “Now it’s time to make it really yours!” aimed to enhance the connection between the user and paper plane. The second instruction “Choose a place on the letter and push to stamp.” encourages people to stamp their “footprints” in this paper plane.

Click to expand
We also observed that many users waited a long time for follow-up feedback at the end of the interaction, link with the problem of low brand connection/resonance. We believe that we can promote advertisers’ products based on the user’s selection preference.
Besides, after users fly out of the paper plane, 3D maps can also be used to promote offline stores and strengthen the connection/resonance with the user.

Click to expand